Posted by Robert M. Haney, PE on Oct 18th 2022
Solenoid Valve Duty Cycle
The temperature of a solenoid valve and the solenoid coil is affected by the solenoid coil power dissipation (I2R watts), the thermal environment, the fluid temperature, and the Duty Cycle of the application. The Duty Cycle of a solenoid valve application can be defined as the ratio (expressed as a percentage) of the ON TIME (valve energized) to the total Cycle Time (ON TIME + OFF TIME).

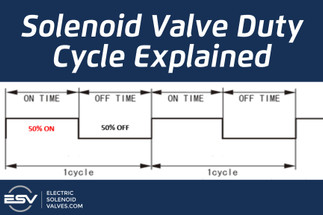
Figure 1: Duty Cycle = On Time / (On Time + Off Time) = 50%
In the figure above the On Time is 50% of the cycle time, so the Duty Cycle is 50%. The average power dissipation in the solenoid coil should be about half of that which would be present if the coil were energized continuously. One would also expect the temperature rise of the solenoid coil to be about half as well.
This application duty cycle should not be confused with the Duty Cycle of electronic PWM control. PWM controllers employ Pulse Width Modulation to efficiently control the current in solenoid coils by adjusting the duty cycle of the PWM voltage applied to the solenoid coil. The frequency of this PWM control is much higher (100Hz to several KHz) than that described above for the application duty cycle. The Period of this PWM current control is typically in the mSec range (Period = 1/(Frequency). The period for the application duty cycle described above is typically much larger (Period = Cycle Time = Seconds, Minutes, or Hours).
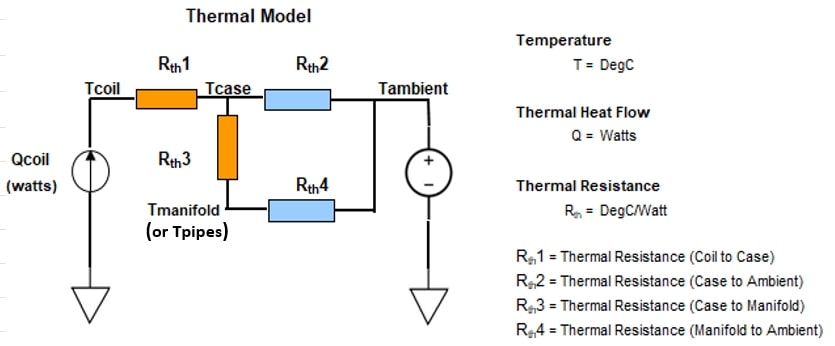
Figure 2 below provides a simple thermal model using an analogy to an electrical circuit. This analogy is often used for electronic devices to predict the junction temperature as a function of the device power dissipation. The device manufacturer provides the thermal resistance from the device case to the device junction. Heat flow (Q) from the solenoid coil power dissipation (I2R watts) is analogous to current flow. Temperature (DegC) is analogous to voltage. Thermal resistance (Rth in DegC per Watt) is analogous to electrical resistance. Just as current flow through electrical resistance results in a voltage rise opposing the current flow; heat flow through a thermal resistance, results in a temperature rise opposing the heat flow. Instead of a manifold block the valve might be connected to metal pipes carrying fluids that are at various temperatures. Heat flow is always from higher temperature to lower temperature

Figure 2: Thermal Model Using Electrical Circuit Analogy
Heat flow from the solenoid coil power dissipation must flow through the thermal resistance Rth1 before being dissipated to the ambient air through Rth2 and through the manifold Rth3. Thermal resistance ‘Coil to Case’ and ‘Case to Manifold’ (Rth1 and Rth3) are primarily by thermal conduction. Thermal resistance ‘Case to Ambient’ and ‘Manifold to Ambient’ (Rth2 and Rth4) are primarily by thermal convection. These thermal resistances are very complex and are not constant but vary with temperature differentials. There may also be other heat paths like thermal radiation from hot surfaces to cooler surfaces.
To understand the effect of Duty Cycle on the solenoid coil, temperature testing of a 24VDC solenoid valve was performed. The temperature of the solenoid coil was calculated from the resistance increase of the coil due to the temperature coefficient of resistance of copper wire:
R(T) = R@25C [1 + Alpha (T - 25)]
Where: Alpha= 0.0039
R(T) = Wire Resistance (ohms) @T
R@25C = Wire Resistance (Ohms) @ 25C
T = Wire Temp (in Deg C)
Solving this equation for temperature gives: T = [(R(T)/R25C) -1]/Alpha +25
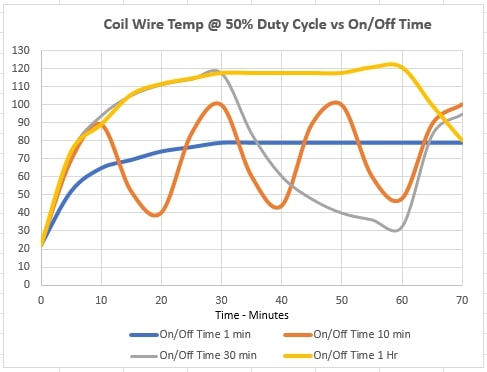
This solenoid valve/mounting block system was tested with an applied voltage of 24Vdc and a 50% duty cycle and at an ambient temperature of 22 Deg C (71.6 Deg F). The cycle time was varied from seconds to minutes up to one hour of operation (see figure 3 below).
Note that the solenoid coil wire temperatures reach a maximum stabilized temperature after about 30 minutes. So the thermal time constant for this system is about 10 minutes (it takes about 3 time constants to reach the stabilized temperatures).

Figure 3: Coil Wire Temperature vs Time @ 50% Duty Cycle
(for On/Off Times 1 Min, 10 Min, 30 Min, & 1 Hour)
Note that for an On Time/Off Time of 1 minute (Cycle Time of 2 minutes) the maximum wire temperature approached about 80 Deg C. On Time/Off Time settings of 1 second & 10 seconds were also performed. For On Time/Off Times less than 1 minute the maximum wire temperature reached the same temperature (80 Deg C).
Note that for On Time/Off Time of 30 minutes, the maximum wire temperature was approaching about 120 Deg C. And for an On Time/Off Time of 1 hour, the maximum wire temperature also approached about 120 Deg C. So when the maximum On Time approaches the thermal stabilization time of 30 minutes we have lost the benefit of 50% Duty Cycle. So we must consider the application to be continuous duty if the On Time approaches or exceeds the 30-minute stabilization time.
Note that for On Time/Off Time of 10 minutes, the maximum wire temperature was approaching about 100 Deg C. So when the On Time approaches the thermal time constant of 10 minutes, we are beginning to lose some of the benefit of the 50% Duty Cycle. The maximum wire temperature is lower than that reached for continuous duty (120 Deg C) but it is 20 Deg C higher than the 80 Deg C temperature reached for shorter On/Off Time settings (1 minute or less).
The thermal stabilization time for many applications could be much longer than the time measured for this test as the volume and mass of the valve system may be much larger. To determine the thermal stabilization time of the system one can energize the valve continuously and monitor the surface temperature of the solenoid coil or the manifold (or system pipes near the valve) and see how long it takes for the temperatures to reach their steady state values.
Since the ambient temperature for these thermal tests was 22 Deg C, the maximum wire temperature would need to be increased for higher ambient temperatures. For example – for an ambient temperature of 100 Deg F (37.8 Deg C) the maximum wire temperature should be increased by 15.8 Deg C (37.8 – 22 = 15.8).
Similar results would be expected from other Duty Cycles. If the Duty Cycle is 30% one would expect the average power dissipation and the temperature rise to be about 30% of that of the Continuous Duty case – assuming, of course, that the maximum On Time is not approaching the system thermal time constant or the system stabilization time.
Of course not all duty cycles conditions are as simple and consistent as this ‘50% On - 50% Off’ example. The best way to establish the duty cycle is by running the valve and monitoring the coil current or voltage under typical operating and environmental conditions. Divide the total ‘On Time’ by the total ‘On Time + Off Time’ to get an approximate average Duty Cycle. If the worst case On Time approaches the system stabilization time, consider the solenoid valve to be continuous duty.
If the maximum wire temperature approaches the maximum rating of the coil magnet wire (typically 180 or 200 Deg C) the wire insulation will begin to melt resulting in shorted turns and eventual burnout. In addition if the coil resistance increases enough to result in current flow below that required to energize the valve actuator, the valve will fail to operate. One must then find ways to lower the coil wire maximum temperature. This might include choosing a coil with lower power dissipation, isolating the valve from external heat sources, or improved cooling of the valve (such as the addition of a fan). Another alternative for DC valves would be to employ an electronic ‘Peak & Hold’ control to reduce the average coil current. This type of control would reduce the coil current after ‘Pull-In’ to a lower ‘Holding’ current since the holding current is typically much lower than the pull-in current. This can result in the reduction of the average power dissipation by as much as 50% or more.
About the Author - Robert M. Haney, PE
Robert M. Haney, P.E. (Rockford, Illinois), is an electrical engineering consultant and adjunct instructor with nearly 40 years of experience in the design, application, and field support of electronic controls and test equipment. He has written extensively about his areas of expertise, including "Solenoid Control, Testing, and Servicing" published by McGraw Hill (Available on Amazon.com). Robert is a registered Professional Engineer in Illinois with a BSEE from General Motors Institute (now Kettering University) and an MSEE from Marquette University. In addition to experience with controls for industrial engines, off-highway equipment, electric power generators, machine tools, and automatic machinery, he has taught DC/AC circuits, electronics, and technical math for Rock Valley College and mathematics for Rasmussen College, Embry-Riddle Aeronautical University, and Upper Iowa University. Mr. Haney has held engineering positions with United Technologies, Caterpillar, Delco Electronics, and Barber Colman Company, and consulting positions with Delta Power Company, Collins Aerospace, M'TE Hydraulics, and Dynacorp. He holds a patent on a tractor draft control system assigned to J.I. Case that uses solenoid coils as sensors (U.S. Patent #4,064,945). He is an active member of IEEE (Institute of Electrical and Electronics Engineers) and the Chicago/Rockford IEEE Consultants' Network; much of his work has been with the electronic control and testing of solenoids and solenoid-based devices.

